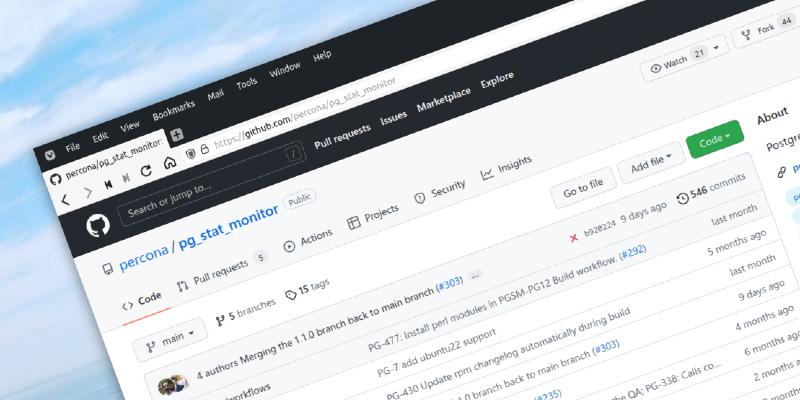
Announcing the release of pg_stat_monitor 1.1.0
Percona is happy to announce the 1.1.0 release of pg_stat_monitor. You can install it from the Percona repositories following the installation instructions.
pg_stat_monitor is a Query Performance Monitoring tool for PostgreSQL. It attempts to provide a more holistic picture by providing much-needed query performance insights in a single view.
pg_stat_monitor provides improved insights that allow database users to understand query origins, execution, planning statistics and details, query information, and metadata. This significantly improves observability, enabling users to debug and tune query performance. pg_stat_monitor is developed on the basis of pg_stat_statements as its more advanced replacement.
Key enhancements in this release:
- The bucket start times are now aligned according to bucket time size units.
- pgsm_normalized_query GUC has been enabled by default now, allowing query parameter values to be available for improved observability. (Note: This option can be disabled at the server start if this behavior is not required, as it does incur a small performance penalty)
- Histogram of query execution time: Track and visualize query execution variability to gain better insight.
For a complete list of changes, please refer to the release notes.
Announcing the release of pg_stat_monitor 1.1.0
A new version of pg_stat_monitor, a Query Performance Monitoring tool for PostgreSQL has been released.

